How often have you applied the JavaScript or CSS solution considered as an optimization,
and after couldn’t find an easy way to measure how effective it was?
Of course, you have the performance timeline recording, but in most cases, it provides the retrospective data, not the life-updated.
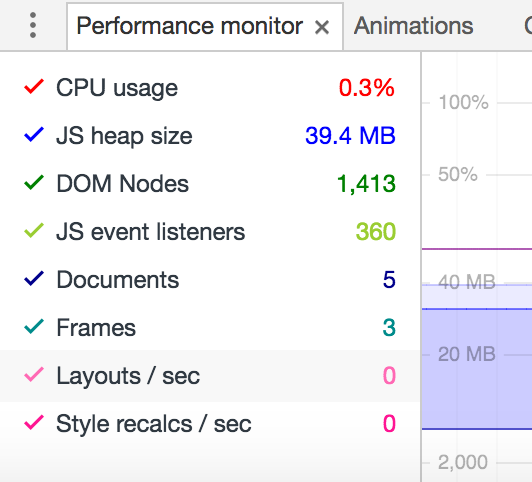
For this and other performance-measuring techniques, Chrome DevTools added the
“Performance Monitor” tab which represents the real-time app performance metrics:
This is available in Chrome stable and to get the “Performance Monitor”:
- Open “chrome://flags/#enable-devtools-experiments” URL
- Activate the “Developer Tools experiments” flag
- Press “Relaunch now” to restart Chrome
- Open Chrome DevTools (CMD/CTRL + SHIFT + I)
- Open DevTools “Setting” -> “Experiments” tab
- Press SHIFT 6 times (sorry 😜) to show the hidden features
- Check the “Performance Monitor” checkbox
- Close and open DevTools (CMD/CTRL + SHIFT + I twice)
- Press “Esc” to open the additional panel with tabs
- Choose the “Performance monitor” in the drawer
- Enable/disable the metrics via click
- Enjoy the “Performance Monitor” if you get here 😀
This gives you many different metrics, most of which are very useful and we could/can measure them in Chrome in some ways (e.g. in Timeline, Performance Tab etc.)
But there are couple new I’d like to share:
- “Layouts / sec” and
- “Style recalcs / sec”
They allow you to measure in the the real-time how performant your CSS solutions are.
For example:
thank’s to csstriggers.com we know,
that change of the top and left
CSS properties triggers the whole Pixel Rendering pipeline stages: paint, layout, and composition.
If we use these properties for the animation, it will trigger dozens/hundreds of operations
per a second.
But if you switch the animation to use “transform” CSS Property with “translateX/Y”, you will find out, that it won’t trigger paint and layout, only the composite stage, which is done on GPU and will decrease your CPU usage nearly to 0%.
All this was described in the Paul Irish’s article Why Moving Elements With Translate() Is Better Than Pos:abs Top/left. For measuring the difference, Paul used the “Timeline”, which showed the triggered Paint/Layout actions. But latest years Paul is working on Chrome DevTools improvements, so I’m not surprised we finally have a proper way to measure the CSS performance in the real-time (I forked his demo to represent the animation props switching):
In general, there are many usages for Performance monitor in Chrome and finally, you have the real-time app performance data available.
<pre><code>...</code></pre>tags in comments