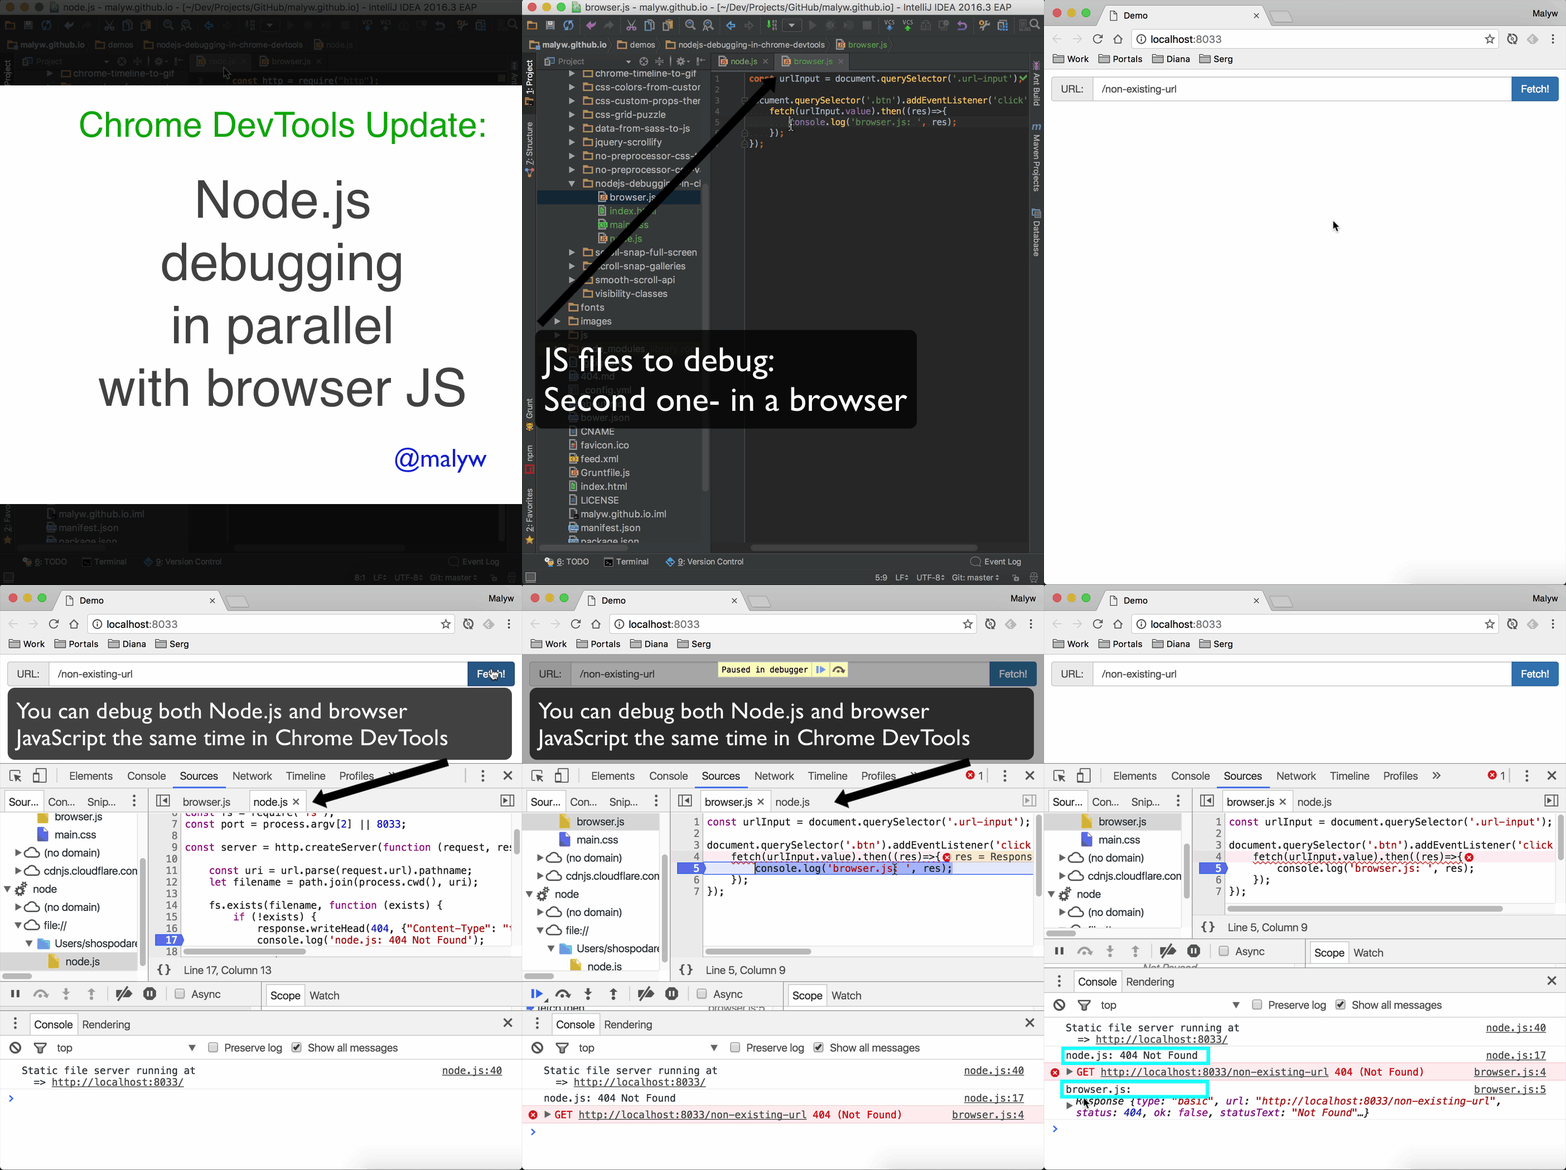
Recently Paul Irish described how you can debug Node.js applications with Chrome DevTools.
Since that time Chrome DevTools have evolved and the step, where you had to open the separate page with a specific URL to debug the Node.js code, was removed.
It means, today you can debug your browser JavaScript files and Node.js ones in the same DevTools window in parallel, which makes the perfect sense.
Let’s take a look how it works.
What you need
1) Node.js 6.3+
You can install it directly from the Node.js site or switch to it using nvm (Node Version Manager)
Better to you use 6.6+ as Paul Irish mentioned in the comment, “in 6.4 there are a few flaky bugs”.
2) Chrome 55+
For that, you can download Chrome Canary
Enable a new way of Node.js debugging in Chrome
Currently the parallel debugging of the browser JavaScript and Node.js code is a new feature and now is qualified as an experiment.
To enable it, you have to do the following:
- Open the chrome://flags/#enable-devtools-experiments URL
- Enable the
Developer Tools experimentsflag - Relaunch Chrome
- Open
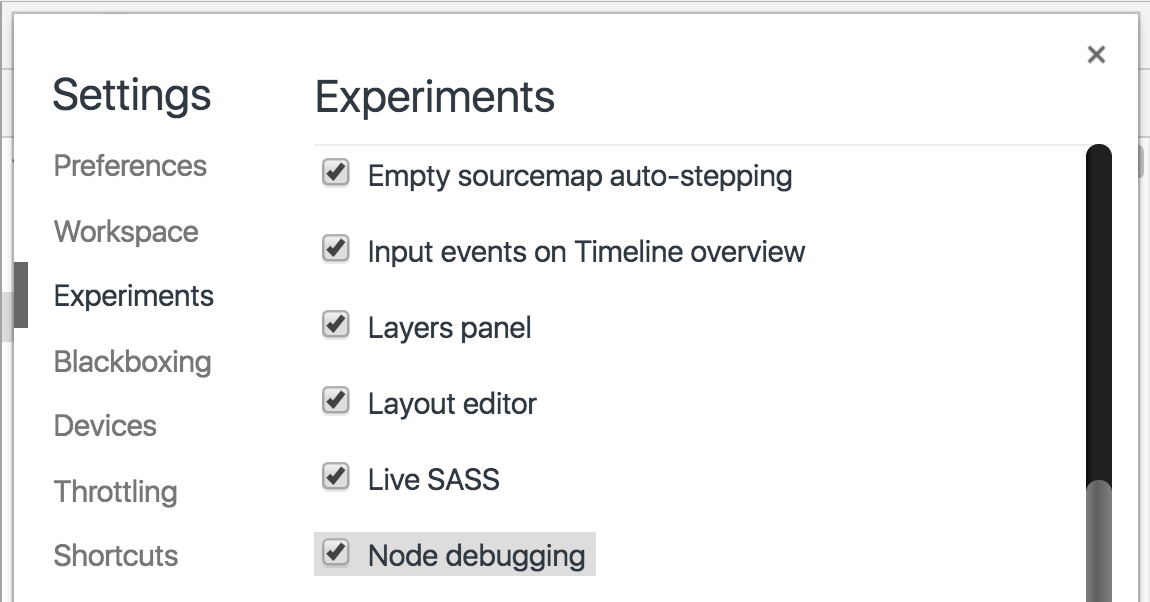
DevTools Setting->Experimentstab (it started being visible after the reload) - Press
"SHIFT"6 times (enjoy it ¯ \ _ (ツ) _ / ¯) to show the hidden experiments - Check the
"Node debugging"checkbox - Open/close DevTools

Debug
To start debugging, just open your page in Chrome and DevTools, as usually.
Start Node.js app
Start the Node.js in the debug mode.
For that add the --inspect argument.
E.g.:
node --inspect node.js
If you do this, you’ll see the output from Node.js, that it started in debug mode and an option to inspect the process opening a separate URL in Chrome:

Debug in DevTools
But we want to debug it in parallel with our browser JavaScript, so switch back to your Chrome.
If you have any console.log or similar output in your Node.js application (outlined with blue on the previous image) , you can notice, that it already appeared in Chrome DevTools console:

After that, you can e.g. put breakpoints in both browser and Node JavaScript files and debug them.
I prepared a demo:
It contains a usual static server using Node.js (node.js file)
and a page which just makes fetch requests to the pointed URL (the code is in the browser.js file).
You can try it to see how easily you can debug Node.js in Chrome.
Just download the demo code from Github and run node --inspect node.js in its folder.
After that open http://localhost:8033/ in Chrome and so you can debug both browser.js and node.js the same time:

Other
As you see, you can put breakpoints in the Node.js code and output from Node.js apps goes to the DevTools console.
But there are many other abilities:
- Live Edit: you can not only debug, but also change the files content
- Profile JavaScript
- Take snapshots etc.
Conclusions
If you use Node.js for your project, now you can debug and make changes for all your JavaScript from one place- Chrome DevTools.
You also can use all the power of Chrome DevTools applying it to Node.js code.

<pre><code>...</code></pre>tags in comments